What is the Community Monitoring Dashboard?

The Community Monitoring Dashboard tracks our progress, informs decision-making, and ensures accountability towards our goals. Key sources of information used to compile the monitoring and reporting results include data from Tourism Whistler, Statistics Canada, Whistler Community Life Surveys, local utility providers, and internal data compiled through RMOW operational protocols. The Community Monitoring Dashboard breaks down Whistlers performance into three categories:

Community Monitoring

The Community Performance Indicators are based on four guiding vision pillars that move us towards our ultimate vision: Whistler: A place where our community thrives, nature is protected and guests are inspired. There are almost 90 indicators of success which were selected through intensive community engagement processes and subsequent strategic plans.

Corporate Indicators

The Resort Municipality of Whistler’s Corporate Plan is consistent with the four pillars of our community vision and the Official Community Plan. The six goals outlined in the Corporate Plan reflect both Council and community objectives. It is updated every year with input from all RMOW departments and informs the organization’s overall work plan.

Facts and Figures

The community facts and figures provide an overview of population and development trends, demographic, socio-economic, as well as household characteristics for Whistler’s permanent resident population. This overview also includes land use trends, recreation visitation trends, and some data for the neighbouring communities of Squamish and Pemberton.

How to use the Community Monitoring Dashboard?

Searching for an indicator and adding to favorites

The search bar can be found on the navigation panel on the left, and can be used to find any indicator within the dashboard. Alternatively, you can use the dropdown lists to find your desired page.

When you arrive on an indicator page, under the title you will find an “add to my favorites” button and a second button to view favorites. These will allow you to shortcut to your most used indicators.


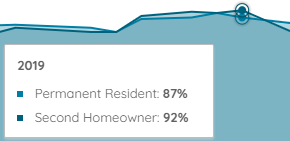
Interacting with charts

All charts have been designed to be interactive and provide a clear visualization of each indicator. If you hover your cursor over any of the data visualizations, a tooltip will appear to show you more information about that particular data point.
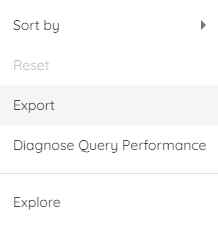
Exporting data

Data within the Community Dashboard is public and available to all users, data can be exported directly from each chart. Simply right click, click “export” and select the file type that you would like to download the data in.

Using the data

The data that is available on the Community Monitoring Dashboard is intended for public use, and the data source has been included for each indicator. Please ensure the correct sources are cited when using data and charts.


Contact Us

The Community Monitoring Dashboard is maintained by RMOW staff. If you have any questions about the dashboard or any of the indicators, please contact economicdevelopment@whistler.ca.